
Inflation is 3.7% and rising. Bond yields just hit a 24-year high. Oil is back above $100. The last 3 times it happened, the S&P 500 fell 20–49%.
The S&P 500 since 1999, and the three drops
Shaded: from the record close to the lowest close that followed. Log scale, so equal drops look equal.
Each of these numbers would be news on its own. This month they arrived together, while the stock market sat at an all-time high. That combination is rare. Since 2000 it has shown up three times, and it did not end quietly once.
Bond yields just hit their highest level since 2002. Oil is above $100. Inflation rose for a second month.
The 10-year Treasury yield is the interest rate the US government pays to borrow for ten years. Almost every other rate in the country is priced off it: mortgages, car loans, company debt. On October 7 it touched 5.36%, the highest since 2002. The 30-year mortgage rate followed it to 7.40%, the highest since November 2023.
Oil is the second pressure. Brent crude settled near $106 a barrel on October 15. Gasoline jumped 9.1% in September alone and pushed inflation to 3.7%, up from 3.4% and above the 3.6% economists expected. The Fed's target is 2%.
And yet the S&P 500 closed at a record 7,818.93 on October 6 and is up about 14% this year. Bonds, oil and prices are all flashing one signal. Stocks are flashing the opposite. One side is wrong.
The 10-year yield
The rate almost every loan is priced off
Oil and gasoline
US crude (WTI) a barrel and the average gallon of gas, before and now
Inflation
Consumer prices, change over 12 months
30-year mortgage rate
Freddie Mac weekly average, a year ago and now
Where things stand, and the last time they were here
October 2026
| Signal | Now | Last time |
|---|---|---|
| 10-year Treasury yield | 5.36% | May 2002. The S&P 500 lost 22% that year. |
| Oil (Brent) | ~$106 | Above $100 in 2022. The S&P 500 lost 18% that year. |
| Inflation (CPI) | 3.7% | March 2000 was 3.8%, the month stocks peaked. |
| 30-year mortgage | 7.40% | November 2023. |
| Fed | Hiked Sept 16 | First hike since July 2023. Next decision Oct 28. |
| S&P 500 | 7,818.93 | Record close on Oct 6, 2026. |
Three times since 2000, stocks hit a record while rates, oil and inflation all rose. Each time the S&P 500 fell at least 19%.
The three drops
Record close to the lowest close that followed, as shaded in the chart at the top of this page
| Record | Low | Drop | |
|---|---|---|---|
| 2000–02 | 1,527 | 777 | −49% |
| 2018 | 2,931 | 2,351 | −20% |
| 2022 | 4,797 | 3,577 | −25% |
| Now | 7,819 | ? | ? |
The same mix, then and now
Inflation, rates, oil and the Fed around each record
| 2000 | 2018 | 2021–22 | Now | |
|---|---|---|---|---|
| Inflation | 3.8% (Mar) | 2.9% (Jul) | Up to 9.1% (Jun 2022) | 3.7% (Sep) |
| 10-year yield, high | 6.79% (Jan) | 3.24% (Nov) | 4.25% (Oct 2022) | 5.36% (Oct 7) |
| Oil (WTI) | ≈2.7× its 1998 low | $77 (Jun) | $124 (Mar 2022) | ~$96 |
| The Fed | Hiking to 6.5% | Four hikes | Hiking from Mar 2022 | Hiked Sept 16; meets Oct 28 |
| S&P 500 after the record | −49% | −20% | −25% | ? |
- Inflation
- 2000
- 3.8% (Mar)
- 2018
- 2.9% (Jul)
- 2021–22
- Up to 9.1% (Jun 2022)
- Now
- 3.7% (Sep)
- 10-year yield, high
- 2000
- 6.79% (Jan)
- 2018
- 3.24% (Nov)
- 2021–22
- 4.25% (Oct 2022)
- Now
- 5.36% (Oct 7)
- Oil (WTI)
- 2000
- ≈2.7× its 1998 low
- 2018
- $77 (Jun)
- 2021–22
- $124 (Mar 2022)
- Now
- ~$96
- The Fed
- 2000
- Hiking to 6.5%
- 2018
- Four hikes
- 2021–22
- Hiking from Mar 2022
- Now
- Hiked Sept 16; meets Oct 28
- S&P 500 after the record
- 2000
- −49%
- 2018
- −20%
- 2021–22
- −25%
- Now
- ?
- Inflation
- 3.8% (Mar)
- 10-year yield, high
- 6.79% (Jan)
- Oil (WTI)
- ≈2.7× its 1998 low
- The Fed
- Hiking to 6.5%
- S&P 500 after the record
- −49%
- Inflation
- 2.9% (Jul)
- 10-year yield, high
- 3.24% (Nov)
- Oil (WTI)
- $77 (Jun)
- The Fed
- Four hikes
- S&P 500 after the record
- −20%
- Inflation
- Up to 9.1% (Jun 2022)
- 10-year yield, high
- 4.25% (Oct 2022)
- Oil (WTI)
- $124 (Mar 2022)
- The Fed
- Hiking from Mar 2022
- S&P 500 after the record
- −25%
- Inflation
- 3.7% (Sep)
- 10-year yield, high
- 5.36% (Oct 7)
- Oil (WTI)
- ~$96
- The Fed
- Hiked Sept 16; meets Oct 28
- S&P 500 after the record
- ?
March 2000. Inflation hit 3.8%, the Fed was raising rates on its way to 6.5%, the 10-year yield had touched 6.79% in January and oil had nearly tripled from its 1998 low. The S&P 500 set a record on March 24. It fell 49% over the next two and a half years and took about seven years to get back.
2018. The Fed hiked four times. Inflation climbed from 2.1% to 2.9%, oil reached $77 and the 10-year hit 3.24%. The S&P 500 set a record on September 20, then fell 20% by Christmas Eve.
2021 to 2022. Stocks set a record on January 3, 2022 as inflation climbed toward 9.1%, oil passed $120 and the Fed started hiking. By October the S&P 500 was down 25%, and bonds fell with it.
The lesson is not that a crash is coming. It is that this mix has never been a calm place to sit with your eyes closed. Each time, the investors who saw the turn early had the most choices.
The Fed decides on October 28. After the inflation report, markets put the odds of another hike near a coin flip.
Market odds of an October hike
Priced by traders in Fed funds futures
Before the September inflation report, traders gave an October hike about one chance in five. Within hours of the 3.7% print, the odds roughly doubled. A second hike in six weeks would push borrowing costs higher just as mortgage rates sit near a three-year high.
Higher rates hit stock prices through a simple channel. When a safe Treasury pays over 5%, investors demand more from riskier assets. The stocks priced furthest into the future, the growth and AI names that carry most of the index, feel it first.
Nearly half of the S&P 500 now rides on AI. In one week, the company at its center lost about $270 billion in value.
By one Wall Street count, AI-linked companies now make up about 45% of the S&P 500's value. If you own an index fund, you own that bet whether you chose it or not.
This week the cracks showed up where they usually show up first: in debt. The Financial Times reported on October 15 that bonds financing big AI data centres have slid below face value, that bonds of the chip-rental company CoreWeave fell below 80 cents on the dollar with yields near 15%, and that Nvidia shed about $270 billion in market value in a week. Allianz's chief investment officer called it a “Darwin moment” for data-centre debt.
How much of the S&P 500 rides on AI
Share of the index's total value
Where AI debt trades now
Cents per dollar of face value, Oct 15
The AI money gap
Revenue AI data-centre owners need by the end of 2030 vs. what AI services are forecast to bring in
Credit cracking before stocks is a pattern worth knowing. In July 2007, two Bear Stearns funds that bet on mortgage bonds lost nearly all their value. The S&P 500 still went on to a record on October 9, 2007, then fell 57%. Bond markets are often the first to say what stock markets have not priced yet.
There is a twist. As money left AI stocks this week, some of it went into Treasuries, and the 10-year yield eased back to about 5.1%. The market is moving between fear of inflation and fear of an AI bust. That is exactly the kind of switch that is hard to see from one headline a day.
What this does not mean.
Stocks are at a record. Isn't that a sign everything is fine?
Records said the same thing in March 2000, September 2018 and January 2022.
A record tells you where prices have been, not what the bond market, the Fed and oil are pricing for next year.
So should I sell everything?
No. Brent oil stayed above $100 for most of 2011 to 2014 with no recession, and after each drop above the S&P 500 went on to new records.
Selling everything on a hunch is its own risk. The goal is to know which kind of market you are in, early.
What should I check before October 28?
How much of my money rides on AI, through my funds as well as my stocks?
What happens to what I own if rates go up again on October 28?
Is today a Risk ON day or a Risk OFF day, and would I know if it changed this week?
The first two take an afternoon with your statements. The third is the one most investors only answer in hindsight.
Risk ONRisk OFF
Predictive Market Intelligence gives you one clear read on the market every day.
Is it Risk ON or Risk OFF, what changed and what it means for your money.
Current regime
Updated every morning
- Liquidity??.?
How much money is moving through the financial system — the fuel behind every rally.
- Capital Stress??.?
Early-warning signs from credit markets — where trouble shows up before it reaches stocks.
- Cycle??.?
Where the economy sits in its cycle — growth, inflation and interest-rate momentum.
- Sentiment??.?
How fearful or greedy investors are — the extremes that mark tops and bottoms.
What you get
- A daily Risk ON / Risk OFF call on the S&P 500
- When to hold and when to step aside, in plain words
- Daily macro briefings: rates, inflation, oil and the AI trade
- Exposure guidance for your own portfolio
- Built from millions of macro data points
Built on institutional‑grade data and leading AI.
The same data sources and models the big desks use, read for you every morning.



As seen on Yahoo Finance.
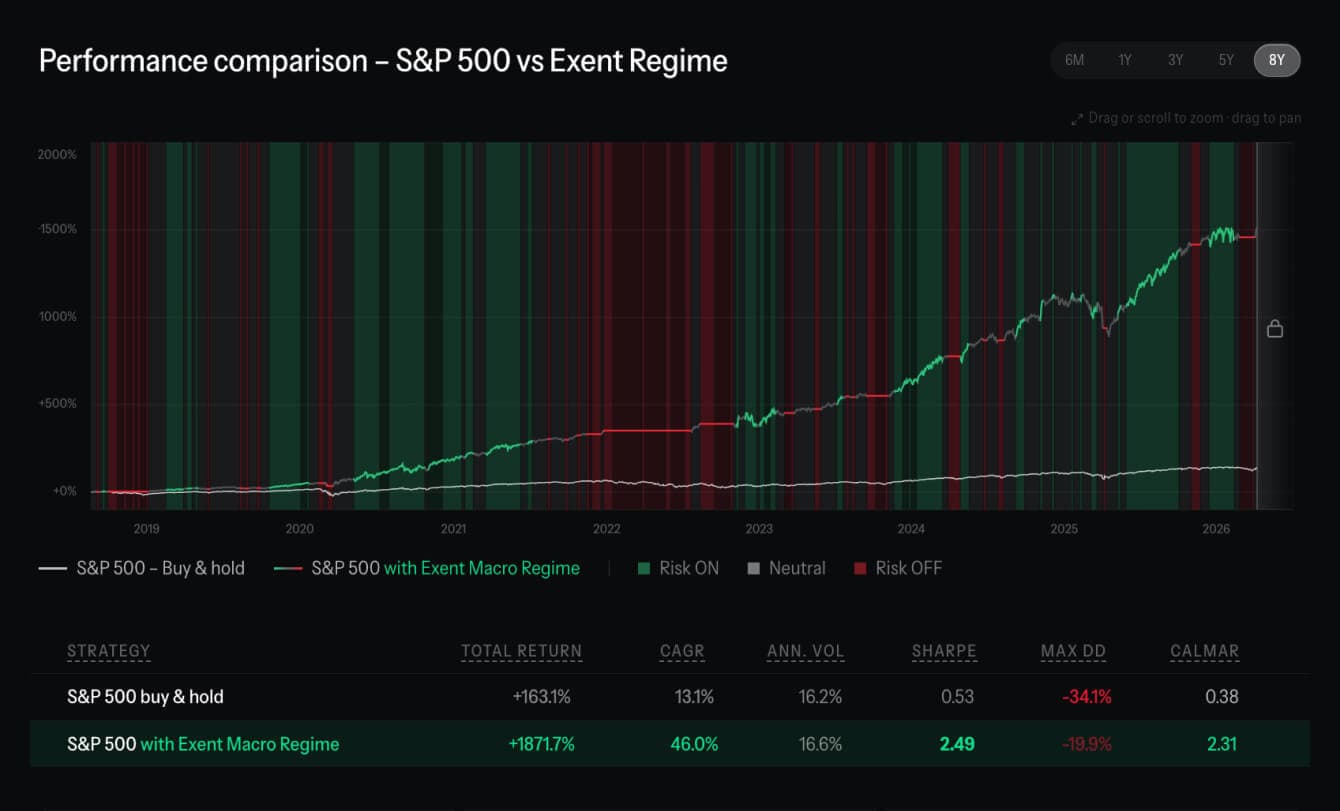
“Exent AI Beat S&P 500 by 10x Over 8 Years”
An eight-year performance analysis of Exent AI’s market regime signal against the S&P 500, as published on Yahoo Finance.
Read full article
Sources
- MercoPress, Treasury yields reach new highs (Oct 12, 2026)
- Forbes, 10-year Treasury yield hits highest level since 2002 (Oct 7, 2026)
- CBS News, September CPI report: inflation accelerated to 3.7% (Oct 14, 2026)
- Rigzone, oil prices as supply risks mount (Oct 15, 2026)
- CNBC, S&P 500 record close (Oct 6, 2026)
- CNBC, investors rotate out of tech stocks into bonds (Oct 15, 2026)
- Federal Reserve, FOMC meeting calendar
- Federal Reserve, policy statement (Sep 16, 2026)
- TheStreet Pro, hot CPI puts October rate hike back in play (Oct 14, 2026)
- Freddie Mac, Primary Mortgage Market Survey (Oct 8, 2026)
- 24/7 Wall St., AI share of the S&P 500 (Oct 12, 2026)
- Financial Times, Investors dump data centre bonds as AI borrowers face 'Darwin moment' (Oct 15, 2026)
- FRED (St. Louis Fed): S&P 500, CPI, WTI oil, 10-year Treasury series
- InvestmentNews, Bear Stearns hedge funds (2007)