



Lean in = accelerate the wins
Stay invested. The flagship regime leans in at 2×.
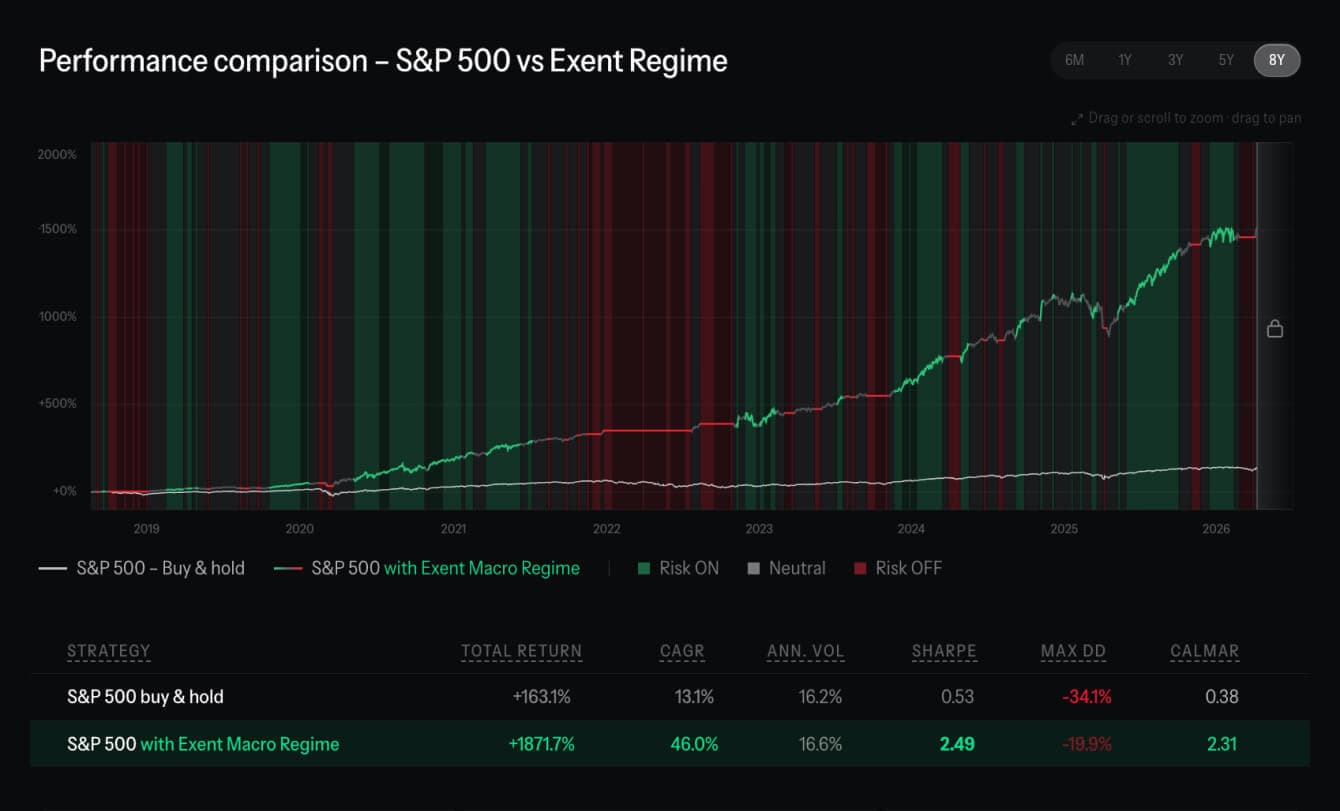
Predictive Market Intelligence tells you when to hold the S&P 500 and when to step aside. Over 8 years, it turned $100,000 into $1.91 million. S&P 500 buy & hold made $286,000.
 Best Institutional-Style Portfolio Analytics for Self-Directed Investors.
 Exent AI Beat S&P 500 by 10x Over 8 Years.
 The Smartest Portfolio Analyzer.
S&P 500 vs Exent Regime
| Total return | CAGR | Ann. vol | Sharpe | Max DD | Calmar | |
|---|---|---|---|---|---|---|
| S&P 500 buy & hold | +79.5% | 21.6% | 12.5% | 1.36 | -19.0% | 1.14 |
| S&P 500 + Exent | +203.5% | 44.9% | 14.7% | 2.75 | -19.9% | 2.26 |
| S&P 500 buy & hold | S&P 500 + Exent | |
|---|---|---|
| Total return | +79.5% | +203.5% |
| CAGR | 21.6% | 44.9% |
| Ann. vol | 12.5% | 14.7% |
| Sharpe | 1.36 | 2.75 |
| Max DD | -19.0% | -19.9% |
| Calmar | 1.14 | 2.26 |
Everyone owns the same index. The difference is knowing when to hold it, and when to step aside. That’s what Exent Regime does.
Ahead of the S&P 500 in 8 of 8 years, including both years the index fell. Worst year: +3.3% in 2018, when the S&P 500 did −12.5%.
Same signal, different amounts of risk. 8-year figures, S&P 500 buy & hold for reference.
| Strategy | Total return | CAGR | Ann. vol | Sharpe | Max DD | Calmar |
|---|---|---|---|---|---|---|
| S&P 500 buy & hold | +186.1% | 14.1% | 16.1% | 0.59 | -34.1% | 0.41 |
| S&P 500 with Exent Regime (2x Graduated) · Best model | +1810.4% | 44.6% | 16.7% | 2.41 | -19.9% | 2.24 |
| S&P 500 with Exent Regime (Graduated) | +355.3% | 20.9% | 8.3% | 1.96 | -10.3% | 2.03 |
| S&P 500 with Exent Regime (2x Risk ON) | +928.6% | 33.8% | 14.0% | 2.10 | -19.0% | 1.78 |
| S&P 500 with Exent Regime (Risk ON) | +230.0% | 16.1% | 7.0% | 1.66 | -9.8% | 1.64 |
| S&P 500 with Exent Regime (Avoid Risk OFF) | +512.9% | 25.5% | 11.5% | 1.82 | -21.6% | 1.18 |
| Total return | +1810.4% |
| CAGR | 44.6% |
| Ann. vol | 16.7% |
| Sharpe | 2.41 |
| Max DD | -19.9% |
| Calmar | 2.24 |
The hard question isn’t what you make in the good years. It’s what you keep in the bad ones.
When the S&P 500 fell roughly 25% through 2022, the model had already shifted to Risk OFF, watching the crash from the sidelines instead of riding it down.
No narratives, no gut calls. The model distills thousands of proprietary data feeds into one 0–100 score: carry risk, or protect capital.



100+ proprietary inputs feed four pillars. Each is scored 0–100, then fused into the single Exent Regime Score.
Updated 1h ago
Previous regime change: 11d agoNeutral 48.5
How much money is moving through the financial system — the fuel behind every rally.
Early-warning signs from credit markets — where trouble shows up before it reaches stocks.
Where the economy sits in its cycle — growth, inflation and interest-rate momentum.
How fearful or greedy investors are — the extremes that mark tops and bottoms.
Stay invested. The flagship regime leans in at 2×.
Protect capital. Losses you mostly don’t take.
The market doesn’t beat most people with bad data. It distracts them with noise, FOMO and fear.
Every newsletter says something different. The more I read, the less I know what to do.
One score replaces fifty open tabs.
Your weekend stays yours.
By the time everyone was talking about the rally, I bought in. That was the top.
The signal turns Risk ON before the headlines do.
I sold in the drop just to stop the bleeding, and then missed the entire recovery.
You exit on data, not fear — and the signal tells you when to come back.
I've been holding cash, waiting for the right moment. It's been two years.
There's always a clear answer: in, or out.
No more waiting for a feeling.
NEW YORK, June 02, 2026 (GLOBE NEWSWIRE) — An eight-year performance analysis of Exent AI’s proprietary Kambo Score market regime signal shows a roughly 1,400 percentage point outperformance gap versus the S&P 500, translating to approximately 10x the benchmark’s total return.
Read full article
“I retired five years ago and my portfolio now has one job, produce income without exposing us to unnecessary risk. During the recent correction everyone was talking about Iran, tariffs and whether another bear market had started. At the same time the S&P 500 was near all-time highs. Without the model I honestly wouldn't have known what to do. The Risk OFF signal gave me confidence to reduce exposure, and when conditions improved I simply followed it back in. I made one decision instead of twenty emotional ones.”

“I've spent my career making decisions based on probabilities, not opinions. What convinced me wasn't the return, it was the drawdown. Losing 20% and losing 34% are completely different experiences when retirement isn't far away. The historical data was objective, easy to understand and exactly what I was looking for.”

“I remember thinking the market couldn't possibly be ready to recover. Every financial channel was still predicting another decline. The system wasn't trying to predict anything, it simply identified that market conditions had shifted. Looking back, staying invested after that signal made a much bigger difference than trying to guess the exact bottom ever could.”

“For years I focused almost entirely on returns. Then I saw the explanation showing why avoiding large losses is actually more important than catching every rally. Losing 50% requires a 100% gain just to recover. That simple chart completely changed my investment philosophy.”

“I used to spend hours reading market commentary. Inflation. AI. Elections. Wars. Every expert had a different opinion. Now I only ask one question: Is this a Risk ON, Neutral or Risk OFF market? That's become my investment process.”

“Mark: I wanted to reduce risk. Jennifer: I wanted to stop talking about markets every evening. We simply check whether the model is Risk ON, Neutral or Risk OFF. There are no arguments anymore about what CNBC or Bloomberg said that day. It's probably the calmest we've ever felt managing our retirement savings together.”

“I still decide what ETFs and stocks I own. Exent doesn't replace my investment decisions. It tells me whether the overall environment supports taking risk. That's a much more useful question than trying to predict where the S&P 500 will close next week.”

“I always avoided leveraged ETFs because I thought they were speculation. Reading how the Flagship model only increases exposure during confirmed Risk ON periods completely changed my perspective. Most of my money remains in the standard strategy, but allocating a smaller portion to Flagship made perfect sense.”

“Markets have climbed to new highs while geopolitical conflicts continue almost every week. That disconnect makes investing surprisingly difficult. The system gives me something far more valuable than predictions. It gives me consistency. I don't have to decide whether today's headline matters.”

“The Sharpe ratio comparison immediately caught my attention. I didn't realize how much additional return had historically come from avoiding severe drawdowns rather than constantly finding better investments. That's why I moved everything into one disciplined process. I finally feel like my portfolio has a system instead of a collection of ideas.”
“I sold during the 2020 panic and stayed in cash far too long. That taught me I needed a plan for getting back in, not just getting out. Market intel gives me a change in conditions to watch for instead of waiting until I feel certain.”
“I once moved to cash during a decline and waited far too long to reinvest. Exent helped me put a re-entry condition into my plan. I still find recoveries uncomfortable to trust, but I’m no longer waiting for the news to sound cheerful.”
“I got tired of managing options positions that needed the market to move my way quickly. Exent’s Flagship approach gave me a simpler framework for expressing a bullish view. I can focus on the risk regime instead of constantly managing expirations.”
“Before I consider a strategy, I want to know how it handled its worst stretches. Exent put drawdowns front and center, which got my attention. Its current risk signal gives me a practical way to apply that concern to my own portfolio.”
“I still make my own allocation decisions, but Market intelligence gives me a consistent starting point.”
“A chart in Market intel showing how hard it is to recover from a large loss finally made drawdown risk real to me. I’d understood the math but hadn’t changed my behavior. Now I check the risk environment before reaching for more return.”
“I invest almost entirely in ETFs, so I wasn’t looking for stock tips. Exent answered the question I actually had: should I review how much market exposure I’m carrying? Its signals give me a practical way to manage an otherwise simple portfolio.”
“I always believed I could simply stay invested through any decline. Then I experienced one that kept me awake at night. Exent market intel helped me set a more realistic approach to risk while I was calm, before the next difficult period.”
“I followed so many finance accounts that I could find someone arguing for any trade. The Predictive regime cut through that for me. I check its reading, then decide whether my portfolio needs attention. It feels less like taking a vote among strangers.”
“We spend winters abroad, and I didn’t want retirement to involve checking markets every morning. With the Macro regime, I can see whether the broader environment has changed and whether my portfolio needs attention. Then I can get on with my day.”
“I help my mother manage her retirement account, and I want her to understand the decisions we make together. Market intelligence gives us a simple starting point. I can show her what changed and why we’re discussing exposure rather than asking her to trust my judgment.”
“Some of our savings are earmarked for our grandchildren’s education. Market alerts prompt me to review whether money we’ll need soon is too exposed when conditions change. That’s helped me treat those funds differently from the money we may not touch for decades.”
“After years of watching crypto around the clock, I wanted a calmer approach to equities. Exent market intel gave me a risk reading I could check on a regular schedule. I still pay attention to markets, but I don’t treat every price move as a call to action.”
“With college getting close, a big decline feels different than it did when our kids were young. Market alerts prompted us to review how much of the money we’ll need soon was exposed. It made that conversation much more concrete.”
Get the live regime score, alerts and all six models today. Your money stays yours, Exent Regime just tells you when to act.
Exent Regime Score (KAMBO) is a temperature reading for the market.
Every day it reads the same conditions the big institutions read — how much money is flowing through the system, how stressed the credit markets are, where we sit in the economic cycle, what mood investors are in — and compresses all of that into one score.
The Exent Macro Regime is the weather forecast built from that score. A forecast cannot stop the rain. It tells you when to take the umbrella, and when the sky is clear enough to leave it home.
KAMBO's score sorts into three regimes:
Conditions support stocks. Stay invested.
Mixed signals. Reduce exposure, do not panic.
Conditions are deteriorating. Stand aside.
Two things KAMBO is not. It does not pick stocks. And it does not predict tomorrow's prices. It tells you what kind of market you are standing in, so the market stops deciding that for you.
Every green and red zone on the chart above is a call. These are the big ones. The red rows are declines it stood aside from. The green rows are runs it stayed invested for.
| When | The call | What happened next | With Exent | With 2x Exent |
|---|---|---|---|---|
| Feb 2020 | Risk Off | The fastest bear market in history. The S&P 500 collapsed as the world shut down. | -30.6% avoided | -55% avoided |
| May 2020 | Risk On | Re-entered while most investors were still hiding. The rebound ran for months. | +22.8% in 6 months | +45% |
| Nov 2020 | Risk On | Vaccine news, liquidity flowing, all four pillars aligned. One of the strongest readings on record. | +27.9% in 6 months | +59% |
| Dec 2021 | Risk Off | Turned defensive with the index near its all time high. The 2022 bear market followed. | -23.5% avoided | -43% avoided |
| Aug 2022 | Stayed Off | A 17 percent summer rally had headlines calling the bottom. KAMBO never confirmed. The rally failed. | -16.8% avoided | -32% avoided |
| Nov 2022 | Risk On | Turned green at 3,993, within weeks of the actual bear market low. The index trades above 7,400 today. | +87% since the signal | +224% |
| Nov 2023 | Risk On | Confirmed conditions ahead of the strongest stretch of the decade and held green for four months straight. | +14.8% while green | +31% |
| Mar 2026 | Risk Off | Turned defensive near the February highs. The index fell for four straight weeks, then KAMBO re-entered for the recovery to new highs. | -7.8% avoided | -15% avoided |
COVID crash
The fastest bear market in history. The S&P 500 collapsed as the world shut down.
The recovery
Re-entered while most investors were still hiding. The rebound ran for months.
The confirmation
Vaccine news, liquidity flowing, all four pillars aligned. One of the strongest readings on record.
The top
Turned defensive with the index near its all time high. The 2022 bear market followed.
The trap
A 17 percent summer rally had headlines calling the bottom. KAMBO never confirmed. The rally failed.
The re-entry
Turned green at 3,993, within weeks of the actual bear market low. The index trades above 7,400 today.
The green light
Confirmed conditions ahead of the strongest stretch of the decade and held green for four months straight.
The latest
Turned defensive near the February highs. The index fell for four straight weeks, then KAMBO re-entered for the recovery to new highs.
For the record, it is not perfect. The initial COVID drop and the April 2025 tariff shock hit faster than macro data moves, and KAMBO adjusted within days rather than in advance. It reads the temperature. It does not predict lightning.
The value shown above came from every slow moving storm of the last eight years, which is where the real money is lost.
Two forces make these calls worth more than the numbers first suggest.
First, losses are not symmetric. Think of a drawdown as a hole. Fall 30% and you need 43% just to climb back to the surface. Fall 50% and you need 100%.
Every decline KAMBO stood aside from means you climb out of no hole at all, and compound from a higher base into the next recovery. That is where the long-term gap really comes from — not the winning trades.
Second, a managed downside changes what upside you can afford. Leverage on its own is how accounts die. The red rows in the 2x column show why: a leveraged investor with no exit signal would have taken a 55% hit in COVID and a 43% hit in 2022.
But with the exits handled, some investors choose to run a 2x index fund during Risk On only. Same signal, doubled moves — and they are standing aside for exactly the periods that destroy leveraged accounts. The Nov 2022 row shows what that looks like when a real bull market follows: 87% becomes roughly 224.
That is the quiet logic behind the whole system. The defense is not the opposite of the offense. The defense is what pays for it.
No screens to learn. No charts to read. The regime changes, you make one adjustment. These are the six KAMBO models available in Market Intelligence, from most conservative to most aggressive.
The simplest version. You are either fully invested or fully in cash — nothing in between.
Best for investors who want maximum protection and are comfortable sitting out extended stretches in cash.
You stay invested through the choppy Neutral periods and only step aside once conditions are confirmed deteriorating.
Best for investors who want to capture most of the cycle and only dodge confirmed downturns.
Instead of an on/off switch, exposure is dialed up and down with the regime, smoothing the ride.
Best for investors who want a smoother ride than an all-or-nothing switch, without predicting anything themselves.
For the aggressive slice of a portfolio only. Leverage is applied only when the regime confirms Risk On — the exits are what make the leverage survivable.
Best for experienced investors who understand leveraged funds and size this as a slice, never the whole portfolio. Doubled moves cut both ways.
2× exposure through Risk ON and Neutral, cash only in Risk OFF. More time at leverage than 2x Risk ON, but still steps aside in confirmed downturns.
Best for investors who want leveraged upside through choppy Neutral periods without sitting in cash, while still dodging Risk OFF.
The flagship model. Leverage compounds through Risk On, full exposure carries through Neutral, and cash protects through Risk Off.
Best for investors who want the highest historical returns of the six models and can tolerate the added volatility of leverage.
Predictive Market Intelligence is Exent's macro regime system. It centers on the KAMBO score—Exent's proprietary macro regime score—along with daily macro briefings and exposure guidance. It is built for investors managing serious capital who want institutional regime awareness every day.
KAMBO is Exent's proprietary macro regime score. The Exent macro regime system synthesizes liquidity, credit stress, economic cycle, and sentiment into that single score. It tells you whether conditions favor aggressive, cautious, or defensive positioning. The system has flagged every major market crash and recovery since 2019. In S&P 500 backtesting, avoiding KAMBO risk-off periods nearly tripled the risk-adjusted return (Sharpe ratio). Maximum drawdown fell from -33.9% to -9.6% versus buy-and-hold. Think of it as a weather forecast for markets. It reads conditions before you deploy capital. Past backtested performance does not guarantee future results.
In backtesting across the S&P 500, NASDAQ, and Russell 2000, strategies guided by the Exent macro regime system and KAMBO score beat buy-and-hold on returns and risk. On the S&P 500, the risk-on strategy returned more while cutting the worst drawdown by roughly two-thirds. On the Russell 2000, buy-and-hold returned 32% over the test period. The same regime filter returned over 4x that. Most damage in investing comes from full exposure during the wrong periods. Regime awareness reads existing conditions and sizes exposure accordingly. These are backtested results. Past performance is not indicative of future returns.
Most market commentary is opinion dressed as analysis. The Exent macro regime system is a systematic, multi-signal composite with no narrative bias. The KAMBO score reads what institutional money responds to: liquidity flows, credit conditions, the economic cycle, and options-market sentiment. The signal updates as data changes, not when a commentator decides to publish.
Yes. The Exent macro regime system passed five independent statistical robustness tests. Cross-asset validation ran identical parameters on three indices with zero re-tuning. Out-of-sample performance improved on unseen data. A one-million-shuffle permutation test confirmed the KAMBO score is statistically real (p = 0.0001). Most market models do not survive this scrutiny. We think you should demand it before trusting any system. Past performance does not guarantee future results.
No. Exent is a research and analytics platform providing model-based insights for informational and educational purposes. It does not recommend trades, execute orders, or manage money. You stay in full control of every decision.
Know when to hold the index and when to step aside. Get the live regime score today.