
Nearly half of the S&P 500 now rides on AI. The last two times one theme got this big, the S&P 500 fell 49% and 25%.
The S&P 500 since 1999, and the last two times one theme took over
Shaded: from the record close to the lowest close that followed. Log scale, so equal drops look equal.
The S&P 500 holds about 500 companies, but not equally. The biggest ones carry the most weight, and the biggest ones today are almost all AI companies. This week showed what that means: the average stock in the index went up, and the index itself still fell 2%.
Nearly half of the S&P 500 is now one theme.
The S&P 500 weights each company by its size. When a handful of companies grow far faster than the rest, they take over the index. As of October 16, the ten biggest positions in the largest S&P 500 fund were all AI-linked companies, and together they were 38.5% of it.
Add the chipmakers, the data-centre builders and the AI software firms further down the list, and about half of the index now rides on one theme. Goldman Sachs puts the AI-linked share at about 45%. Our own count of the holdings comes to about 51%. Anyone who owns AI stocks, an index fund, or both is holding the same trade.
What drives the S&P 500
Share of the index's value, by our count (Oct 16)
The index's 10 biggest companies
38.5% of the S&P 500. Every one is an AI-linked company.
- Nvidia
- 7.86%
- Apple
- 7.46%
- Microsoft
- 5.99%
- Amazon
- 3.74%
- Alphabet (class A)
- 3.06%
- Alphabet (class C)
- 2.45%
- Broadcom
- 2.45%
- Meta
- 2.43%
- Micron
- 1.57%
- Tesla
- 1.53%
- Top 10 together
- 38.5%
This week the AI half did the falling. The average stock went up.
The week of October 12–16
Price change of each index or sector fund over the week
The Nasdaq ended a four-week winning streak with its worst week since June. Chip stocks fell almost 10%. AI software lost about $260 billion in value. CoreWeave, a company that rents out Nvidia chips, lost about a quarter of its value in five days, and its bonds sold off until they yielded more than 15%.
Meanwhile utilities, energy and banks rose, and the typical S&P 500 company ended the week slightly up. If the index held every company equally, it would have ended the week up too. Because it holds the AI giants most, it lost 2% in a week, ten days after setting a record.
The last two times one theme was this big a slice of the S&P 500, it fell 49% and 25%.
One theme at the top, and what followed
The two falls shaded in the chart at the top of this page
| One theme at the top | What followed | |
|---|---|---|
| 2000–02 | Tech ≈ 33% of the index | S&P 500 −49% · Nasdaq −78% |
| 2022 | Top 10 ≈ 30% of the index | S&P 500 −25% · Nasdaq-100 −33% |
| Now | AI ≈ 45–51%, top 10 = 38.5% | ? |
2000. The internet was real, and it changed everything. Tech had grown to about a third of the S&P 500 when the market peaked in March 2000. Over the next two and a half years the Nasdaq fell 78% and the S&P 500 fell 49%.
2022. After two years of the biggest tech stocks carrying the market, the top ten were about 30% of the index. When rates rose, the S&P 500 fell 25% and the Nasdaq-100 fell 33%.
AI companies are earning real money, and this is not a prediction that AI is a bubble. It is a reminder that when one trade is half of the market, a bad week for that trade is a bad week for the market, and a bad year is a bad year.
Is this just a dip, or the start of something bigger?
Every big fall started out looking like a dip. In March 2000 and January 2022, the first weeks looked a lot like this one: a record, a sharp drop in the leaders, a bounce that brought buyers back. Most dips recover within weeks. Some don't. From the inside, the first days of both look the same.
So the question that matters is not whether AI is a bubble. It is whether the market has already turned Risk OFF, and what to do with your portfolio if it has.
If the market is Risk ON
Money is flowing, credit is calm, the trend is up
- The dip is likely a dip: selling into it locks in the loss
- Investors stay invested and keep their core positions
- Weak weeks are where they add to what they believe in
If the market is Risk OFF
Money is leaving, credit is cracking, the trend has turned
- A dip can turn into a long drawdown, like 2000 or 2022
- Investors trim what is most exposed, here the AI-heavy part
- They keep cash ready to buy back lower when it turns
So, are we already in a Risk OFF market? That is the one question most investors only answer in hindsight, after the damage is done.
The next four weeks decide a lot. The Fed and the biggest AI companies report in the same days.
Oct 27
Durable goods, home sales and consumer confidence
Oct 28
Fed rate decision at 2 p.m. ET, then the press conference
Oct 29
Q3 GDP and September inflation (PCE)
Late October
Microsoft, Alphabet, Meta, Apple and Amazon earnings (expected)
Mid-November
Nvidia earnings (expected)
What this does not mean.
So should I sell my AI stocks?
Not on a headline. AI companies are earning real money, and many dips in the last few years recovered within weeks.
The better question is which market this is. In a Risk ON market, dips get bought. In a Risk OFF market, they get deeper.
Aren’t these companies too big to fail?
Cisco was the most valuable company in the world in March 2000 and kept growing for years. Its stock fell 86% by October 2002.
Great companies can still be bad prices. Size protects the business, not the share price.
How would I know if the AI trade is turning?
Not from one headline. Rates, credit, the economy and investor mood usually move before the index does.
That is what a daily Risk ON / Risk OFF read is for: one answer every morning, before the market makes it obvious.
Risk ONRisk OFF
Predictive Market Intelligence gives you one clear read on the market every day.
Is it Risk ON or Risk OFF, what changed and what it means for your money.
Current regime
Updated every morning
- Liquidity??.?
How much money is moving through the financial system — the fuel behind every rally.
- Capital Stress??.?
Early-warning signs from credit markets — where trouble shows up before it reaches stocks.
- Cycle??.?
Where the economy sits in its cycle — growth, inflation and interest-rate momentum.
- Sentiment??.?
How fearful or greedy investors are — the extremes that mark tops and bottoms.
What you get
- A daily Risk ON / Risk OFF call on the S&P 500
- When to hold and when to step aside, in plain words
- Daily macro briefings: rates, inflation, oil and the AI trade
- Exposure guidance for your own portfolio
- Built from millions of macro data points
Built on institutional‑grade data and leading AI.
The same data sources and models the big desks use, read for you every morning.



As seen on Yahoo Finance.
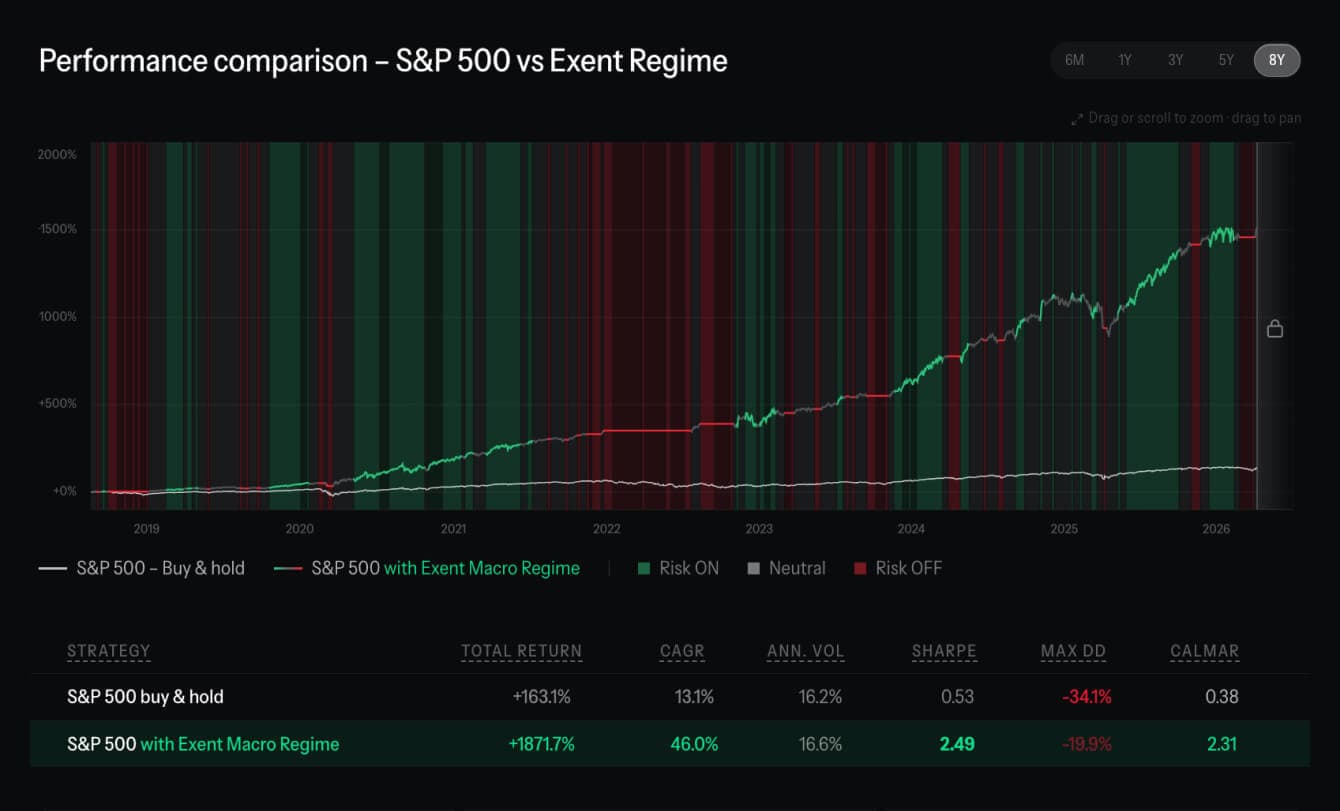
“Exent AI Beat S&P 500 by 10x Over 8 Years”
An eight-year performance analysis of Exent AI’s market regime signal against the S&P 500, as published on Yahoo Finance.
Read full article
Sources
- SPDR S&P 500 ETF (SPY) holdings, as of Oct 16, 2026
- 24/7 Wall St., AI share of the S&P 500 (Goldman Sachs basket) (Oct 12, 2026)
- CNN, Nasdaq sinks more than 2% as investors raise questions about AI debt (Oct 16, 2026)
- Yahoo Finance, Markets news, Oct 16, 2026: Nasdaq, S&P 500 post weekly losses
- The Motley Fool, tech stocks plunge as AI software valuations reverse (Oct 16, 2026)
- Financial Times, Investors dump data centre bonds as AI borrowers face 'Darwin moment' (Oct 15, 2026)
- Federal Reserve, FOMC meeting calendar
- FRED (St. Louis Fed): S&P 500 and Nasdaq history